Site Search
85 results for dividend scale
-
Market Commentary July 2025
Key Takeaways
• Markets were very volatile in April to start Q2 but calmed as the quarter progressed. Volatility was driven mostly by headlines about tariffs, but other fiscal policy developments also had an impact.
• Equity markets sold off sharply at the start of the quarter, continuing Q1’s weakness. Markets rebounded sharply once worst-case fears over tariffs eased. The markets continued to rally through the quarter as trade negotiations progressed. Stronger-thanexpected corporate earnings also boosted markets. Despite the shaky start to the quarter, most global equity markets set new all-time highs in Q2.
• Canadian bond markets delivered slightly negative returns in Q2. Weak performance was driven by rising interest rates, which outweighed the impact of tighter credit spreads. Higher interest rates hurt the performance of longer-term bonds most.
• Both the Bank of Canada and the U.S. Federal Reserve adopted a wait-and-see approach. They each held rates steady during Q2, awaiting greater clarity on the impacts of tariffs on both growth and inflation before considering further cuts.
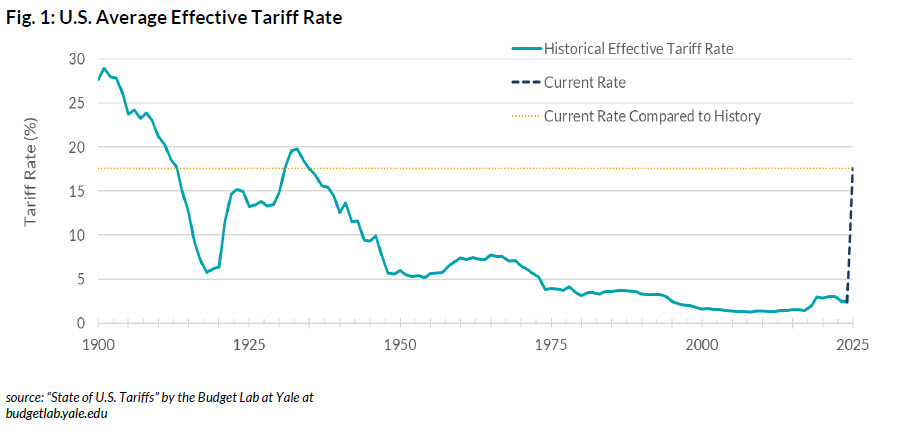
Economic and Market UpdateEconomic Summary: Most indicators of economic activity in the U.S. continued to expand at a decent pace. However, GDP data for the first quarter came in weaker than expected, as higher imports ahead of anticipated tariffs and weaker spending by consumers weighed on Q1 GDP. That said, GDP growth is expected to bounce back in Q2. Tariffs will likely continue to be an evolving story, with potential impacts on both economic growth and inflation. Those impacts will remain uncertain until trade agreements have been finalized.
In early April, President Trump announced larger-than-expected reciprocal tariffs, with the impact most notable on trade with China. However, progress followed with a 90-day pause in tariff implementation. The U.S. then reached trade agreements with the UK, China, and Vietnam. Negotiations with other major trade partners are ongoing. The conflict between Israel and Iran raised inflation concerns, due mostly to the possibility of higher oil prices. Those concerns eased following a ceasefire. Congress passed Trump’s tax cut and spending bill, raising concerns about its potential impact on the U.S. fiscal burden. Meanwhile, U.S. labour market conditions remain resilient, with the unemployment rate remaining low. Inflation has eased slightly but remains above the Federal Reserve’s target. Amid heightened uncertainty, the Federal Reserve held interest rates steady at 4.25%–4.50% at both of its meetings in Q2. Chair Jerome Powell stated that the Fed is “well positioned to wait for greater clarity before considering any adjustments to our policy stance.”
.jpg "Fig-One-(1).jpg")
In Canada, tariffs and trade-related uncertainty continue to weigh on the economy. A pullforward of exports and inventory accumulation ahead of tariffs helped keep first-quarter GDP firm, but growth is expected to slow in the second quarter. The labour market has weakened, particularly in trade-sensitive sectors. Inflation remains within the Bank of Canada’s 1–3% preferred range. However, core CPI remains above the Bank’s preferred 2% target. Canada’s fiscal deficit is expected to widen as Prime Minister Mark Carney aims to fast-track infrastructure development and increase defense spending. Amid ongoing trade uncertainty, the Bank of Canada held its policy rate at 2.75% during its April and June meetings. Governor Tiff Macklem signaled the Bank’s readiness to cut rates further if economic conditions deteriorate.
.jpg "Fig-Two-(1).jpg")
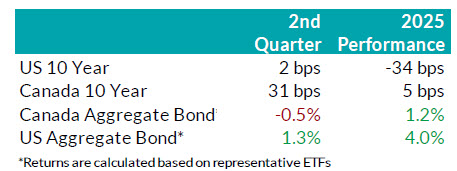
Bond Markets: During Q2, the FTSE Canada Universe Bond Index returned -0.6%. Yields for Canadian bonds rose across all maturities over the quarter. That reflected reduced expectations for rate cuts by the Bank of Canada and a higher risk premium on long-term debt. The impact of higher yields on government bonds was offset in part by tightening of credit spreads on provincial and corporate bonds. Overall corporate bonds saw a positive return for the quarter and outperformed government bonds, in part due to the strong recovery in credit spreads that started in late
April. While corporate issuance slowed considerably in April due to increased trade policy uncertainty, issuance in the Canadian bond markets during May and June were robust. There were 83 deals during Q2 that combined to raise $37 billion for issuers. June 2025 was the 3rd busiest month for issuance on record. We continue to expect higher credit spreads as the U.S. tariffs impact global growth. As such, we have maintained our conservative view with a bias towards shorter corporate bonds but remain ready to invest in longer corporate bonds as valuations become
attractive.
.jpg "Fig-Three-(1).jpg")
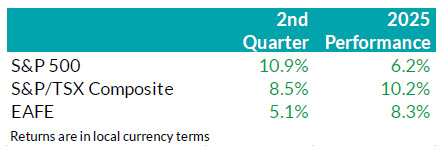
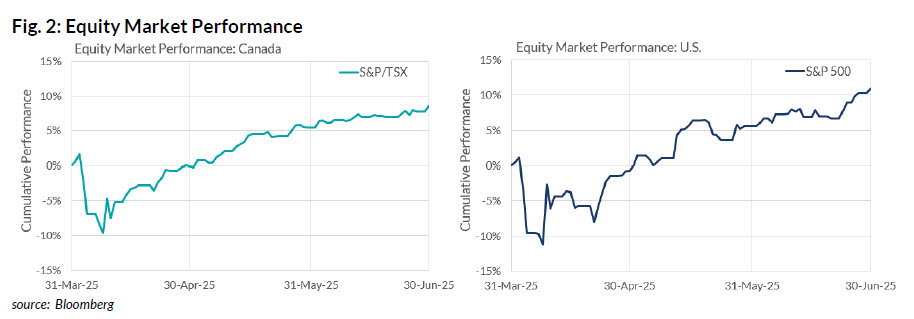
Stock Markets – Overview: Having done a round-trip following April tariff announcements, technology, consumer discretionary and industrial companies propelled the U.S. equity market to another record high. The S&P 500 ended the quarter up about 11%, outperforming Canadian and international markets. Canadian equities gained 8.5% in Q2, buoyed by front-loaded demand that benefited the Materials sector, while Financials recovered from a poor Q1. Meanwhile, as risk sentiment stabilized following the 90-day tariff pause and U.S. equities regained momentum, the appeal of the “Sell America” trade diminished. As a result, Europe, Australasia, and the Far East (EAFE) markets finished the quarter with a more modest gain of just over 5%, lagging the sharper
recovery seen in North America.
.jpg "Fig-Four-(1).jpg")
U.S. Equities: The U.S. equity market staged a V-shaped recovery on strong company earnings data in the second quarter. A stable job market and muted inflation reinforced the view of a resilient U.S. economy. At a company level, we observed positive corporate earnings surprises, steady profit margins and better-than-expected forward earnings guidance. Together they underpinned the equity market’s sharp reversal to the upside. Market breadth also improved over the quarter, with strength extending beyond Technology to include Industrials and Financials. That signalled that the market rally was supported by investors’ confidence in the U.S. economy. Furthermore, structural investment trends in artificial intelligence (AI) continued to accelerate, highlighted by rising enterprise capex in data centres. Beyond AI, Circle, a blockchain-based platform that supports stablecoin issuance, tokenized assets, and digital payment infrastructure, conducted a successful IPO. Its share price jumped 485% from its listing price as of quarter-end. On June 17, the U.S. Senate passed the Guiding and Establishing National Innovation for U.S. Stablecoins (GENIUS) Act, a regulatory framework for use of tokenized assets. While investors wait for the House’s decision, equity price actions suggest that the policy environment is increasingly supportive of blockchain innovation and digital efficiency.
Canadian Equities: Canadian equities posted solid gains in Q2, with Financials overtaking Materials to lead the market higher. Momentum from the Materials sector, which benefited from the pull-forward demand related to U.S. tariff uncertainty, faded toward quarter-end. Meanwhile, cooling inflation and muted domestic growth pushed investors towards highquality, high-dividend-paying companies. Notably, banks significantly outperformed the broader market, as investors favoured their stable corporate fundamentals. Energy surged briefly amid escalating geopolitical tensions, but those gains proved short-lived. In recap, investors in the Canadian market faced slowing resource demand and a stalling domestic economy, which fueled increased interest in high-quality, high-dividend-paying companies. That is a trend we expect to continue going forward.
Bottom line: Markets remain heavily influenced by sentiment, with U.S. policy developments and ongoing tariff negotiations continuing to cause periodic volatility. However, there is little
evidence of deterioration in the hard data to date. As such, we continue to anchor our positioning on underlying data rather than market narratives. Looking ahead, the combination of a structurally higher-for-longer interest rate environment and increasingly pro-growth policy backdrop presents selective opportunities. In the U.S., this favours highquality growth stocks, particularly within Technology, where strong balance sheets and long-term thematic tailwinds remain intact. In Canada, Financials, especially the relatively inexpensive banks, present a more compelling opportunity as earlier tailwinds from pullforward demand are beginning to wane. While we remain constructive, we are mindful of elevated equity valuations and continue to closely monitor macro conditions and policy developments for signs of inflection.
Downloadable Copy
Mark Warywoda, CFA
VP, Public InvestmentsIan Whiteside, CFA, MBA
AVP, Public InvestmentsJohanna Shaw, CFA
Director, Public InvestmentsJin Li
Director, Equity Investments
Wanyi Chen, CFA, FRM
Sr. Quantitative Analyst
Andrew Vermeer, CFA
Senior Analyst, Credit
Elizabeth Ayodele
Analyst, Credit
Edward Ng Cheng Hi
Analyst, Credit
Francie Chen
Analyst, Rates
ADVISOR USE ONLY
-
Market Commentary July 2025
Key Takeaways
• Markets were very volatile in April to start Q2 but calmed as the quarter progressed. Volatility was driven mostly by headlines about tariffs, but other fiscal policy developments also had an impact.
• Equity markets sold off sharply at the start of the quarter, continuing Q1’s weakness. Markets rebounded sharply once worst-case fears over tariffs eased. The markets continued to rally through the quarter as trade negotiations progressed. Stronger-thanexpected corporate earnings also boosted markets. Despite the shaky start to the quarter, most global equity markets set new all-time highs in Q2.
• Canadian bond markets delivered slightly negative returns in Q2. Weak performance was driven by rising interest rates, which outweighed the impact of tighter credit spreads. Higher interest rates hurt the performance of longer-term bonds most.
• Both the Bank of Canada and the U.S. Federal Reserve adopted a wait-and-see approach. They each held rates steady during Q2, awaiting greater clarity on the impacts of tariffs on both growth and inflation before considering further cuts.
Economic and Market UpdateEconomic Summary: Most indicators of economic activity in the U.S. continued to expand at a decent pace. However, GDP data for the first quarter came in weaker than expected, as higher imports ahead of anticipated tariffs and weaker spending by consumers weighed on Q1 GDP. That said, GDP growth is expected to bounce back in Q2. Tariffs will likely continue to be an evolving story, with potential impacts on both economic growth and inflation. Those impacts will remain uncertain until trade agreements have been finalized.
In early April, President Trump announced larger-than-expected reciprocal tariffs, with the impact most notable on trade with China. However, progress followed with a 90-day pause in tariff implementation. The U.S. then reached trade agreements with the UK, China, and Vietnam. Negotiations with other major trade partners are ongoing. The conflict between Israel and Iran raised inflation concerns, due mostly to the possibility of higher oil prices. Those concerns eased following a ceasefire. Congress passed Trump’s tax cut and spending bill, raising concerns about its potential impact on the U.S. fiscal burden. Meanwhile, U.S. labour market conditions remain resilient, with the unemployment rate remaining low. Inflation has eased slightly but remains above the Federal Reserve’s target. Amid heightened uncertainty, the Federal Reserve held interest rates steady at 4.25%–4.50% at both of its meetings in Q2. Chair Jerome Powell stated that the Fed is “well positioned to wait for greater clarity before considering any adjustments to our policy stance.”
In Canada, tariffs and trade-related uncertainty continue to weigh on the economy. A pullforward of exports and inventory accumulation ahead of tariffs helped keep first-quarter GDP firm, but growth is expected to slow in the second quarter. The labour market has weakened, particularly in trade-sensitive sectors. Inflation remains within the Bank of Canada’s 1–3% preferred range. However, core CPI remains above the Bank’s preferred 2% target. Canada’s fiscal deficit is expected to widen as Prime Minister Mark Carney aims to fast-track infrastructure development and increase defense spending. Amid ongoing trade uncertainty, the Bank of Canada held its policy rate at 2.75% during its April and June meetings. Governor Tiff Macklem signaled the Bank’s readiness to cut rates further if economic conditions deteriorate.
Bond Markets: During Q2, the FTSE Canada Universe Bond Index returned -0.6%. Yields for Canadian bonds rose across all maturities over the quarter. That reflected reduced expectations for rate cuts by the Bank of Canada and a higher risk premium on long-term debt. The impact of higher yields on government bonds was offset in part by tightening of credit spreads on provincial and corporate bonds. Overall corporate bonds saw a positive return for the quarter and outperformed government bonds, in part due to the strong recovery in credit spreads that started in late
April. While corporate issuance slowed considerably in April due to increased trade policy uncertainty, issuance in the Canadian bond markets during May and June were robust. There were 83 deals during Q2 that combined to raise $37 billion for issuers. June 2025 was the 3rd busiest month for issuance on record. We continue to expect higher credit spreads as the U.S. tariffs impact global growth. As such, we have maintained our conservative view with a bias towards shorter corporate bonds but remain ready to invest in longer corporate bonds as valuations become
attractive.
Stock Markets – Overview: Having done a round-trip following April tariff announcements, technology, consumer discretionary and industrial companies propelled the U.S. equity market to another record high. The S&P 500 ended the quarter up about 11%, outperforming Canadian and international markets. Canadian equities gained 8.5% in Q2, buoyed by front-loaded demand that benefited the Materials sector, while Financials recovered from a poor Q1. Meanwhile, as risk sentiment stabilized following the 90-day tariff pause and U.S. equities regained momentum, the appeal of the “Sell America” trade diminished. As a result, Europe, Australasia, and the Far East (EAFE) markets finished the quarter with a more modest gain of just over 5%, lagging the sharper
recovery seen in North America.
U.S. Equities: The U.S. equity market staged a V-shaped recovery on strong company earnings data in the second quarter. A stable job market and muted inflation reinforced the view of a resilient U.S. economy. At a company level, we observed positive corporate earnings surprises, steady profit margins and better-than-expected forward earnings guidance. Together they underpinned the equity market’s sharp reversal to the upside. Market breadth also improved over the quarter, with strength extending beyond Technology to include Industrials and Financials. That signalled that the market rally was supported by investors’ confidence in the U.S. economy. Furthermore, structural investment trends in artificial intelligence (AI) continued to accelerate, highlighted by rising enterprise capex in data centres. Beyond AI, Circle, a blockchain-based platform that supports stablecoin issuance, tokenized assets, and digital payment infrastructure, conducted a successful IPO. Its share price jumped 485% from its listing price as of quarter-end. On June 17, the U.S. Senate passed the Guiding and Establishing National Innovation for U.S. Stablecoins (GENIUS) Act, a regulatory framework for use of tokenized assets. While investors wait for the House’s decision, equity price actions suggest that the policy environment is increasingly supportive of blockchain innovation and digital efficiency.
Canadian Equities: Canadian equities posted solid gains in Q2, with Financials overtaking Materials to lead the market higher. Momentum from the Materials sector, which benefited from the pull-forward demand related to U.S. tariff uncertainty, faded toward quarter-end. Meanwhile, cooling inflation and muted domestic growth pushed investors towards highquality, high-dividend-paying companies. Notably, banks significantly outperformed the broader market, as investors favoured their stable corporate fundamentals. Energy surged briefly amid escalating geopolitical tensions, but those gains proved short-lived. In recap, investors in the Canadian market faced slowing resource demand and a stalling domestic economy, which fueled increased interest in high-quality, high-dividend-paying companies. That is a trend we expect to continue going forward.
Bottom line: Markets remain heavily influenced by sentiment, with U.S. policy developments and ongoing tariff negotiations continuing to cause periodic volatility. However, there is little
evidence of deterioration in the hard data to date. As such, we continue to anchor our positioning on underlying data rather than market narratives. Looking ahead, the combination of a structurally higher-for-longer interest rate environment and increasingly pro-growth policy backdrop presents selective opportunities. In the U.S., this favours highquality growth stocks, particularly within Technology, where strong balance sheets and long-term thematic tailwinds remain intact. In Canada, Financials, especially the relatively inexpensive banks, present a more compelling opportunity as earlier tailwinds from pullforward demand are beginning to wane. While we remain constructive, we are mindful of elevated equity valuations and continue to closely monitor macro conditions and policy developments for signs of inflection.
Downloadable Copy
Mark Warywoda, CFA
VP, Public InvestmentsIan Whiteside, CFA, MBA
AVP, Public InvestmentsJohanna Shaw, CFA
Director, Public InvestmentsJin Li
Director, Equity Investments
Wanyi Chen, CFA, FRM
Sr. Quantitative Analyst
Andrew Vermeer, CFA
Senior Analyst, Credit
Elizabeth Ayodele
Analyst, Credit
Edward Ng Cheng Hi
Analyst, Credit
Francie Chen
Analyst, Rates
ADVISOR USE ONLY
-
EAMG Market Commentary July 2024
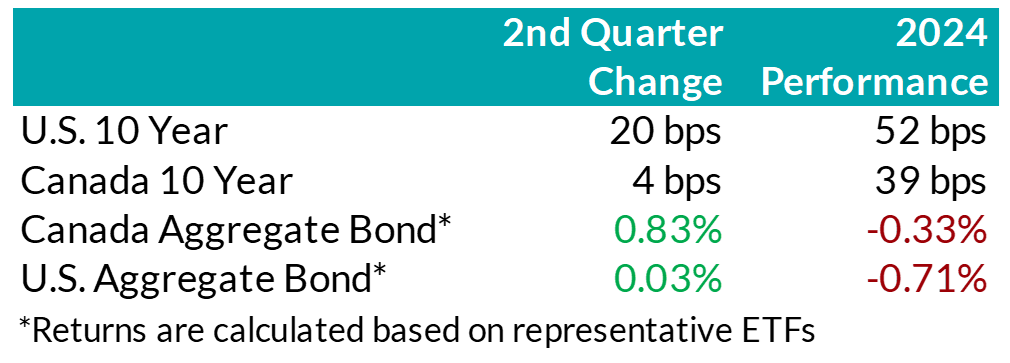.png "Picture1-(3).png") Rates & Credit – In Q2 2024, U.S. inflation and economic growth data was mixed, leading to moderately higher interest rates in the U.S. Meanwhile, in Canada, long-end interest rates were little changed during the quarter, but short-term interest rates fell. That was due to the weaker economic outlook, as well as the Bank of Canada’s decision to reduce its overnight interest rate in June, with anticipation of further monetary policy easing to come. Canadian corporate bonds returned 1.1%, outperforming the 0.8% return of government bonds as well as the 0.9% return for the overall FTSE Canada Universe Bond index. Shorter-dated bonds outperformed longer-dated bonds. Within corporate bonds, lower-rated BBBs outperformed higher-rated A bonds, while industries that have shorter-dated debt (e.g. real estate and financials) outperformed those that tend to have longer-dated debt (e.g. communications and infrastructure).
Rates & Credit – In Q2 2024, U.S. inflation and economic growth data was mixed, leading to moderately higher interest rates in the U.S. Meanwhile, in Canada, long-end interest rates were little changed during the quarter, but short-term interest rates fell. That was due to the weaker economic outlook, as well as the Bank of Canada’s decision to reduce its overnight interest rate in June, with anticipation of further monetary policy easing to come. Canadian corporate bonds returned 1.1%, outperforming the 0.8% return of government bonds as well as the 0.9% return for the overall FTSE Canada Universe Bond index. Shorter-dated bonds outperformed longer-dated bonds. Within corporate bonds, lower-rated BBBs outperformed higher-rated A bonds, while industries that have shorter-dated debt (e.g. real estate and financials) outperformed those that tend to have longer-dated debt (e.g. communications and infrastructure).
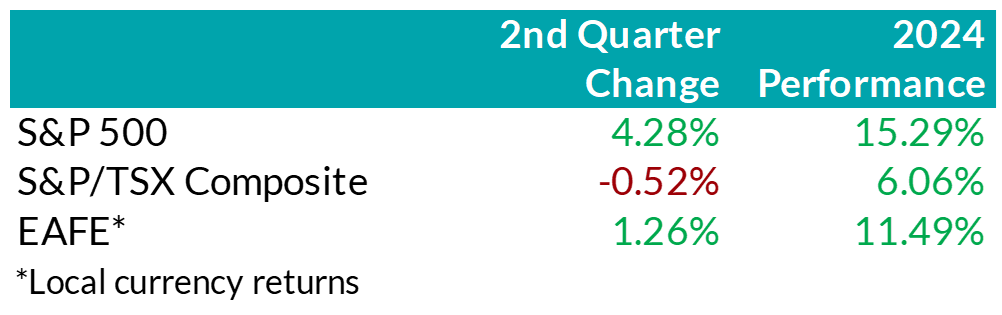.png "Picture2-(2).png") Equity Overview – Against the backdrop of volatile inflation data and a lack of indication from the Federal Reserve that it was prepared to start cutting interest rates yet, U.S. equity markets decoupled from other regions. Crowding into AI-focused, mega-cap names accelerated in Q2. More specifically, investors defaulted toward the Magnificent 7 to navigate the current period, overlooking broadening earnings breadth and less expensive valuations from the remaining S&P 493. Outside the U.S., equity returns were generally mundane in dollar terms. That said, emerging markets proved to be a bright spot for investors seeking value, as the rebound in heavily discounted Chinese equities helped push frontier markets higher.
Equity Overview – Against the backdrop of volatile inflation data and a lack of indication from the Federal Reserve that it was prepared to start cutting interest rates yet, U.S. equity markets decoupled from other regions. Crowding into AI-focused, mega-cap names accelerated in Q2. More specifically, investors defaulted toward the Magnificent 7 to navigate the current period, overlooking broadening earnings breadth and less expensive valuations from the remaining S&P 493. Outside the U.S., equity returns were generally mundane in dollar terms. That said, emerging markets proved to be a bright spot for investors seeking value, as the rebound in heavily discounted Chinese equities helped push frontier markets higher.
U.S. Fundamentals – Corporate earnings continued to surpass expectations last quarter with stable operating margins helping businesses report better-than-expected bottom line results. Investors remain focused on the ability of companies to sustain debt levels ahead of renewing debt obligations, rewarding businesses with a strong ability to generate stable cash flows. Moreover, while prior quarters have witnessed earnings growth that was largely driven by highly profitable mega-cap technology stocks, U.S. markets are witnessing a broadening trend in earnings strength, with previously stunted segments of the market recovering. Our work shows that members of the Russell 1000 index, excluding the Magnificent 7, posted a median earnings growth of about 6% last quarter, with nearly 60% of companies increasing earnings versus the year prior. Furthermore, we observed an increase in the number of major companies that expect improving financial performance to approximately 27%, suggesting that the recovery in earnings breadth may persist.
U.S. Quant Factors – As mentioned, concentration in the equity market drove a surge in valuations as investors continued to chase specific mega-cap technology stocks. In fact, within the Russell 1000 growth factor – which screens for companies whose earnings are expected to grow at an above-average rate relative to the market – the Magnificent 7 totaled nearly 55% of the entire index by quarter-end. In addition, the Nasdaq 100 – which is generally viewed as a technology-biased index – saw the weight of the Magnificent 7 rise to almost 43% of the entire index by the end of the quarter. Furthermore, the equal-weighted S&P 500 underperformed the cap-weighted index by nearly 7% last quarter, bringing the year-to-date divergence to about 10%. With concentration accelerating, the cap-weighted index outperformance has soared past Covid-era levels, a period that saw investors rapidly crowd into profitable technology names due to panic and economic uncertainty. We remain cautious of a severely crowded market that trades near all-time highs as strong performance from 5-7 names distorts the overall stature of market conditions.
Canadian Fundamentals – Although Canadian companies exceeded bleak forecasts, earnings continue to contract on a year-over-year basis. Furthermore, earnings revisions have grinded lower with easing monetary conditions unable to offset concerns of a slowing economic environment. We note the sharp contrast versus the U.S. as the bifurcation of earnings performance widens. The CRB Raw Industrials Index, a measure of price changes of basic commodities, broke out of recent ranges as metals rallied higher despite a stronger U.S. dollar and elevated interest rates. The mining industry benefited from a sustained elevation in prices, helping the materials sector outperform over the quarter. Returns from the heavily-weighted Canadian banks were constrained last quarter with company-specific drivers – including regulatory challenges from TD, and underwhelming U.S. results from BMO – limiting performance. More broadly, the banks continue to build prudent credit provisions to mitigate uncertain economic forecasts and remain well capitalized.
Canadian Quant Factors – With investors remaining attentive to businesses’ ability to create value relative to financing costs, we see value in high quality, dividend-paying companies with strong earnings sustainability and a healthy degree of leverage. Based on our work, investors of the Canadian banks appear well compensated, with the current premium between value creation and current yield remaining compressed. In our opinion, the market has modest expectations regarding prospects for value generation from the banks and, therefore, we believe the industry stands to benefit if the premium reverts closer to historical norms. We also continue to see sources of quality dividend opportunities within certain areas of the energy sector. More specifically, we believe companies that have taken steps to improve their balance sheets through deleveraging efforts, and with improved operating leverage, offer attractive prospects given their stable and high-yielding composition.
Views From the Frontline
Rates – During the first half of the second quarter, interest rates in both Canada and the U.S. increased, continuing the upward momentum from Q1. Higher-than-expected inflation data in the U.S. along with mixed economic growth data caused investors to push out expectations for when the U.S. Federal Reserve would start lowering its interest rate. This trend shifted in the second half of Q2, as positive economic momentum slowed in the U.S. economy and inflation data began to soften. Interest rates in Canada declined more rapidly than in the U.S. due to more benign inflation, a weaker job market, and economic growth remaining below population growth. This economic weakening provided the confidence required for the Bank of Canada to cut rates by 25 basis points in June to 4.75%. The Bank also signaled that if inflation continues to ease and the Bank’s confidence grows that inflation would continue to trend toward its 2% inflation target, it is reasonable to expect further cuts. The second quarter marked a pivotal point for the global policy easing cycle. Sweden, Canada, and the European Central Bank all began lowering their policy rates, and Switzerland made a second rate cut, following one in Q1. The market continues to speculate on the timing of the U.S. Federal Reserve’s first rate cut. Interest rate cut expectations are largely unchanged in Canada since last quarter, with a total of three rate cuts expected throughout 2024. Expectations for the rate cuts by the U.S. Federal Reserve declined slightly, however, to two cuts in 2024.
Credit – The risk premium for corporate bonds (versus government bonds) was largely flat over the quarter, with spreads approaching the tight post-pandemic levels experienced in 2021. Corporate bond supply continues to be very robust, with $41bn in new issuance. Year-to-date, corporate issuance has set a new record, with an impressive $80bn in issuance. On balance, we do not think the current risk premium adequately compensates for downside risk, particularly in longer-dated corporate bonds, and have a bias towards shorter-dated credit where we view the risk / reward trade-off as being more favourable.
Equity – On the backdrop of a heavily concentrated U.S. market rally, we remain cautious of the distortion to market returns from high-flying technology stocks. As a result, we continue to favour a combination of the Dow Jones Industrial Average and the S&P 500 for our broad U.S. market exposure. The Dow provides a more diversified exposure to 30 prominent large-cap companies and less concentration in technology relative to the S&P. Broadening earnings strength presents an opportunity for previously out-of-favour names to “catch-up”. In our view, companies outside the Magnificent 7 that have demonstrated robust earnings growth, strong cash flow generation, along with decreased debt loads, are well-positioned to benefit from internal market rotations. As such, we gain exposure to these companies through the quality factor – companies with higher return-on-equity, strong operating performance, and healthy leverage levels – and the dividend growth factor – businesses with a lengthy and established history of increasing dividends.
In Canada, we remain attentive to how efficiently corporations are generating profits relative to financing costs. Looking forward, we continue to monitor the ability of businesses to generate profits given a decline in capital spending. More specifically, we are focused on businesses’ ability to grow and sustain dividends amid the lag between easing monetary conditions and consumption. Due to this, we observe value in higher yielding companies that are higher on the spectrum of quality. Geographically, we maintain our overweight U.S. exposure, underpinned by encouraging U.S. inflation data trends, broadening corporate earnings growth, and normalizing consumption. In addition, sluggish Chinese data and the lack of positive earnings revisions from EAFE tilt the risk-adjusted return profile in favour of the U.S. Lastly, as a Canadian investor, fluctuations in the Loonie’s relative value versus other major currencies continues to present tactical trading opportunities within our investment mandate.
Downloadable Copy
Mark Warywoda, CFA
VP, Public Portfolio ManagementIan Whiteside, CFA, MBA
AVP, Public Portfolio ManagementJohanna Shaw, CFA
Director, Portfolio ManagementJin Li
Director, Equity Portfolio Management
Tyler Farrow, CFA
Senior Analyst, Equity
Andrew Vermeer
Senior Analyst, Credit
Elizabeth Ayodele
Analyst, Credit
Francie Chen
Analyst, Rates
ADVISOR USE ONLY
Any statements contained herein that are not based on historical fact are forward-looking statements. Any forward-looking statements represent the portfolio manager’s best judgment as of the present date as to what may occur in the future. However, forward-looking statements are subject to many risks, uncertainties, and assumptions, and are based on the portfolio manager’s present opinions and views. For this reason, the actual outcome of the events or results predicted may differ materially from what is expressed. Furthermore, the portfolio manager’s views, opinions or assumptions may subsequently change based on previously unknown information, or for other reasons. Equitable® assumes no obligation to update any forward-looking information contained herein. The reader is cautioned to consider these and other factors carefully and not to place undue reliance on forward-looking statements. Investments may increase or decrease in value and are invested at the risk of the investor. Investment values change frequently, and past performance does not guarantee future results. Professional advice should be sought before an investor embarks on any investment strategy.
- [pdf] Shareholder Borrowing Checklist
-
EAMG Market Commentary August 2022

August 2022
The S&P 500 fell into bear market territory over the first half of 2022 with the index down -20.6%. This represented a top 10 ranking amongst the most dismal back-to-back quarterly performances going back to 1928. While comparisons have been made to the inflation driven bear market of 1973-74, the economic backdrop today has some significant differences including greater production capacity (factory utilization rates are running about 20% lower vs the 70’s) and a meaningful decline in raw industrial prices which have fallen -11% over the quarter. While these economic anecdotes are potential positives for the future, it’s important to remain cognizant that prices remain elevated.
As such, the US Federal Reserve seems to be taking every opportunity to telegraph their intentions of raising interest rates at the expense of both market and economic performance, so long as inflation remains a threat. Given this hawkish tone, the market narrative has morphed from fears of inflation to a fed driven recession. As a result, the move in the bond market has been swift with the 10-year treasury yield peaking at approximately 3.5% in June to today’s level of 2.7% (lower rates = higher bond prices). This positive bond performance reflects the consensus view that inflation is temporary (2023 CPI forecasts are approximately 3.6% vs the second quarter’s 8.7% CPI reading) and could allow the Fed to adjust their higher interest rate trajectory downward. The Fed also remains confident that a soft landing is achievable, and a recession avoidable.
Investors seem less convinced however, given the Fed has never been able to engineer a soft landing before, and so it’s no surprise equity markets entered a bear market over the quarter, and currently remain in a technical correction (defined as losses greater than -10%). To better assess future performance, we closely monitor earnings results to understand how companies are navigating these economic trends. With nearly 80% of the S&P 500 reported, the results have been better than expected, but still the EPS beat rate and magnitude of beats (actual vs expectation) remain below 5-year averages. This tells us companies are finding today’s economic conditions more challenging than the recent past. Consumer sectors including marketing, retail, autos and textiles posted the 2nd worst performance vs other sectors while the Financials sector saw the greatest challenges with aggregate EPS falling by -15% year-over-year. Wall Street analysts have started to revise S&P 500 forward growth estimates lower, a trend which we expect will continue for several quarters ahead. The forward (12-month blended) P/E ratio of 17.5 times remains 1.5 multiple points above the long-term average which potentially suggests risks may not be fully priced in.
In terms of the S&P/TSX Composite, after declining nearly -14% in Q2 as recession fears around the world jeopardized the global demand outlook, its’ since rebounded over 4.0%. Still, valuation remains below longer-term averages at 11.8x forward earnings with the heavier weighted Financials and Energy sectors trading at 9.5x and 7.9x, respectively. TSX earnings expectations have stalled as of late but downward revisions are lagging US and European counterparts. Additionally, the domestic labour market remains tight which has allowed the Bank of Canada to continue its aggressive rate hike path to curb soaring inflation. For most of 2022 the TSX has benefitted from surging commodity prices but an economic slowdown in China resulting from its commitment to a zero-Covid policy and a potential global recession could prove to be a challenge for the Canadian market.
Equity markets on average lose 30% of their value in recession led bear markets. If we use this as a potential road map, it suggests the S&P 500 could have further to fall. Using past performance as a forward-looking tool however is an imperfect technique and used in isolation of what’s happening today can often mislead.
Accounting for today’s backdrop, we come up with three scenarios of varying probabilities. The first is the most optimistic and includes an engineered soft landing by the Fed, meaning no recession and inflation cools. A less optimistic view is the fed tames inflation with higher interest rates but tips the economy into a mild-to-moderate recession. The outcome would be consumer spending and corporate hiring slow as a result of tighter financial conditions, and therefore financial results are negatively impacted. The least optimistic scenario is one where stagflationary conditions emerge as inflation continues to accelerate at the expense of growth despite higher interest rates, in other words the Fed loses control. The net result would be similar to our second scenario but with much more dire results in terms of unemployment, household spending and impacts to corporate profitability. While we don’t rule out any of the above scenarios completely, we assign the highest probability to the second one where macro economic issues get resolved at some point in the future, but the full effects of inflation and a possible recession have yet to be priced into the market. Currently, this view translates into a slight underweight equity position versus our benchmark with a tilt towards low volatility and defensive strategies along with an overlay of value and dividend paying securities. In other words, we’ve de-risked the portfolios relative to our benchmark to manage potential downside risks but remain meaningfully invested an on absolute basis. As always, time in the market tends to overcome trying to time the market, and so employing a strategic and diversified strategy is often the most prudent approach.
Downloadable Copy
ADVISOR USE ONLY
Any statements contained herein that are not based on historical fact are forward-looking statements. Any forward-looking statements represent the portfolio manager’s best judgment as of the present date as to what may occur in the future. However, forward-looking statements are subject to many risks, uncertainties and assumptions, and are based on the portfolio manager’s present opinions and views. For this reason, the actual outcome of the events or results predicted may differ materially from what is expressed. Furthermore, the portfolio manager’s views, opinions or assumptions may subsequently change based on previously unknown information, or for other reasons. Equitable Life of Canada® assumes no obligation to update any forward-looking information contained herein. The reader is cautioned to consider these and other factors carefully and not to place undue reliance on forward-looking statements. Investments may increase or decrease in value and are invested at the risk of the investor. Investment values change frequently, and past performance does not guarantee future results. Professional advice should be sought before an investor embarks on any investment strategy. - [pdf] Equitable’s Legacy Products: Personal Investment Portfolio and Pivotal Solutions
- [pdf] Equitable GIF Fees and Fund Codes
- Sample portfolios
-
All about the changes to the capital gains inclusion rate
Disclaimer: The following content is provided by and is the opinion of Invesco Canada Ltd. Equitable does not guarantee the adequacy, accuracy, timeliness, or completeness of the information. Equitable shall not be liable for any errors or omissions in the information provided by Invesco.
What has changed?
One noteworthy measure to come from Budget 2024 is the proposed change to the capital gains inclusion rate, which was previously held steady at 50% since 2001.
For individuals, capital gains more than $250,000 annually will be subject to an increased 66.67% inclusion rate as of June 25, 2024, while the capital gains up to $250,000 will continue to be subject to the existing 50% inclusion rate. As a transitional measure for 2024, only the capital gains realized by individuals on or after the effective date of June 25 that are above the $250,000 threshold will be subject to the increased inclusion rate.
For trusts and corporations, the inclusion rate on all capital gains will increase from 50% to 66.67% starting on June 25, 2024.

Who is affected?
Impact to individuals
Budget 2024 proposed to add transitional rules which would specifically identify capital gains and losses realized before the effective date (Period 1) and those realized on or after the effective date (Period 2). The effective date is June 25, 2024. Capital gains realized on or after that date will have an inclusion rate of 50% on the amount up to $250,000, and an inclusion rate of 66.67% on the amount above $250,000. All capital gains realized prior to the effective date will have an inclusion rate of 50%.
Take Ontario as an example, the proposed higher inclusion rate on capital gains would effectively increase the average federal-provincial marginal tax rate for Ontario residents on capital gains above $250,000 at the top marginal tax rate from 26.76% to 35.69%. A more detailed analysis on the impact of these changes to an individual’s tax rate is discussed below.
For net capital gains realized in Period 2, the annual $250,000 threshold would be fully available in 2024 (i.e., it would not be prorated) and it would apply only in respect of net capital gains realized in Period 2.
The $250,000 threshold would effectively apply to capital gains realized by an individual, either directly or indirectly via a partnership or trust, net of any: current-year capital losses, capital losses of other years applied to reduce current-year capital gains, and capital gains in respect of which the Lifetime Capital Gains Exemption, the proposed employee Ownership Trust Exemption or the proposed Canadian Entrepreneurs’ Incentive claimed.
Two common scenarios of reaching the $250,000 capital gain threshold are the deemed disposition of capital property at death, and the emigration from Canada (i.e., becoming a non-resident for income tax purposes). We have provided additional details on these topics below.
Deemed disposition upon death
When an individual passes away, they are deemed to have sold their capital property (e.g., units or shares of mutual funds, shares of corporations, and real property) at its fair market value (FMV) immediately before their death. If a capital gain arises because of this deemed disposition, that capital gain is reportable on the deceased’s final (terminal) tax return and the taxes owing as a result, if any, would be payable by the estate of the deceased. However, there are provisions that allow taxes to be deferred when the property is transferred to a spouse. For example, if a capital property is transferred to a surviving spouse or common-law partner, subsection 70(6) of the Income Tax Act (Canada) automatically deems the deceased to have disposed of that property and the spouse or common-law partner immediately acquires the same property at the deceased transferor’s adjusted cost base (ACB). This is commonly referred to as the “spousal rollover”. Another potential strategy to manage potential large capital gains taxes at death is life insurance, since the death benefit is typically paid out tax-free.
Without careful planning, the estate value could be substantially reduced by the changes to the capital gains inclusion rate. Furthermore, it would be prudent to ensure there are liquid assets or cash available in the estate to cover the associated tax liabilities.
Non-resident of Canada – Departure tax
Residency in Canada for income tax purposes is a question of fact, which primarily depends on the individual’s residential and social ties in Canada. When an individual becomes a non-resident of Canada, they are deemed to have disposed of and immediately reacquired certain types of property at FMV. The tax incurred because of this deemed disposition and reacquisition is also known as the departure tax. Some examples of properties subject to departure tax include securities inside a non-registered investment portfolio, shares of Canadian private corporations, and real estate situated outside of Canada. Note that there are some properties that are exempted from the departure tax, including: pensions and similar rights (including registered retirement savings plans (RRSPs), registered retirement income funds (RRIFs), and tax-free savings accounts (TFSAs)) and Canadian real property.
The departure tax rules coupled with the increased capital gain inclusion rate above the $250,000 threshold may incur additional tax payable for emigrants. However, there is an option to defer the payment of departure tax on income associated with the deemed disposition upon emigration. By making an election, the individual would pay the tax later, without interest, when the property is disposed of. This election can be done by completing CRA Form T1244, “Election Under Subsection 220(4.5) of the Income Tax Act, to Defer the Payment of Tax on Income Relating to the Deemed Disposition of Property," on or before April 30 of the year following their departure from Canada.
Impact to Entities
Corporations and trusts will also be impacted by the increased inclusion rate as of June 25, 2024. Unlike individuals, corporations and trusts will not have access to the old inclusion rate on the first $250,000 of capital gains: they will be subject to the new 66.67% inclusion rate from the very first dollar.
With the above in mind, there will be options available to shelter corporate and trust capital gains from the new inclusion rate.
For corporations:
The lifetime capital gains exemption (LCGE) can be used to eliminate capital gains taxes on the sale of qualified small business corporation shares (generally, these are shares of a Canadian-controlled private corporation that carries on an active business). The LCGE is also available on the sale of qualified farm or fishing property. The current lifetime limit for the LCGE is $1,016,836. Budget 2024 proposed to increase that limit to $1,250,000 starting on June 25, 2024, so certain business owners will be able to reduce or eliminate their exposure to the new inclusion rate if they are able to make use of the increased LCGE limit.
For trusts:
Budget 2024 suggests that capital gains allocated by a trust to its beneficiaries on or after June 25, 2024, will be included in the beneficiaries’ income at the old 50% rate up to the beneficiaries’ first $250,000 of capital gains for the year. While the specifics are not yet available, this opportunity will likely create further planning considerations surrounding the allocation of capital gains from a trust to its beneficiaries to reduce taxes. Capital gains can generally be allocated to a beneficiary for tax purposes when they are actually paid to the beneficiary, or when they are payable to a beneficiary (i.e., the beneficiary hasn’t received it, but has a right to demand payment of the capital gain). The option of making income paid (or payable) to its beneficiaries and allocating such income to be taxed in their hands will largely depend on the trust terms.
Historical reference: capital gains inclusion rate
Those of us around long enough, understand that this recent change was not the only time the capital gains inclusion rate has deviated from the 50% inclusion rate. Over the years, capital gains tax rate has ranged from nil to as high as 75% as indicated in the table below. In fact, the first instance of capital gain tax was introduced in 1972!
.jpg")
Excluding the 2024 tax year, we have given a rough estimate on the percentage of time spent at each of the various capital gains inclusion rates over the last 42 years. As we can see, for most of the time, the capital gains inclusion rate has remained at the 50 % inclusion rate. In fact, for the last 23 consecutive years, the inclusion rate has remained untouched with the last change being back in tax year 2000 with various changes introduced that year.

Tax impact by province/jurisdiction
With the increase in the capital gains inclusion rate, we want to demonstrate the potential tax impact of those changes across jurisdictions in Canada. The table below shows the 2024 marginal tax rate for the highest individual income earners in each jurisdiction at both the 50% and 66.67% capital gains inclusion rate, respectively. The average difference is an increase in taxes payable by 8.45%.

Next, we look at the additional taxes payable because of the inclusion increase, assuming varying capital gains income levels. Of course, this assumes that the capital gains do not otherwise benefit from a reduced inclusion rate or an outright exemption such as eligible in-kind donations of securities to registered charities, or shares that qualify for the lifetime capital gains exemption, to name a few.

Understanding the tax implications of investing is an essential part of financial planning and reinforces the importance of working with a knowledgeable financial advisor to understand the long-term impact of these changes as it applies to personal situations. No doubt, tax rates influence capital allocation decisions. Canadians who take more inherent risk with their capital have traditionally been afforded preferred taxation rates promoting innovation through capital investment, something the government can do with good tax policy to encourage business growth and spur economic expansion. This is evident in the breakdown of the tax rates depending on the characterization of the income as noted in the table below.

Clearly the tax rates reflect the added capital risk investors and business owners take. We can clearly see the preferred taxation rates afforded on small business income and at the general corporate tax rates on income over the small business limit, compared to the tax rate on interest income or that of employment income. That tax-preference also extends to investors of “riskier” allocations of capital in marketable securities such as stocks, bonds, mutual funds, and exchange traded funds, to name a few. The tax rates of less-risky investments (such as money market instruments) do not benefit from the capital gains tax-preferred inclusion rates. With the latest move, there is not much difference in earning eligible dividend income from Canadian resident corporations and from dispositions resulting in capital gains.
Some pundits have declared the move as a disincentive to capital and business investment and may encourage businesses to move into more tax-favoured jurisdictions outside Canada. The Federal government has promoted the change as impacting a very small overall percentage of investors, estimated at 0.13% of Canadian individuals and 12.6% of corporations. Further, the move has been argued by the Liberals as necessary to work towards “intergenerational fairness”.
How to prepare for the changes?
For now, advisors may want to start educating their clients about the basics of the changes, which starts with comparing the current inclusion rates with the new inclusion rates.
Individual investors with large unrealized capital gains will also likely ask if they should crystallize their capital gains before June 25th to save money on taxes in the long run. The assumption that selling now will result in overall savings will not be correct in all cases, however. There is an opportunity cost to paying taxes upfront, rather than deferring those taxes to a later year.
For example, let’s assume an Ontario client owns a $2.5 million non-registered equity portfolio with $2,000,000 in unrealized capital gains. They had no intention of selling those investments for another 5 yeas, but in light of the upcoming changes, they are considering selling immediately, paying the capital gains taxes now, then reinvesting the net amount after taxes back into those same investments for the 5-year investment period. They are currently in the top marginal tax bracket in Ontario (53.53%) and expect to continue to be in 5 years’ time. The assumed average rate of return on their investments is 6% annually over the next 5 years.


As can be seen in this example, at 6% annual compound growth rate, the option to realize much of the capital gains now resulted in a higher overall return in the amount of $61,992.66 over the 5-year period due to the lower inclusion rate. Alternatively stated, if the investor does not crystallize the gains today, the equivalent rate of return needed to have the exact net after tax amount at the end of the 5-year period (the “breakeven return”) would be a 6.60% compound annual return. While this certainly will not be true in all cases, this is the sort of analysis that will have to be conducted when assessing whether it makes sense to realize capital gains in 2024. The rate of return on investment and the investment horizon, among other things, are important determining factors.
Although we used securities investment in our example, a similar analysis can be done for other kinds of property held, such as a vacation property that is unlikely to benefit from the principal residence exemption. In addition, taxes often take a back seat to other planning considerations. These conversations should be had with the primary goals of the client in mind, which may supersede tax planning considerations.
For corporate investors, it will be important to emphasize the impact the capital gains inclusion increase will have on small business owners. As a refresher, a corporation is a separate legal entity from the shareholders who own it and is subject to tax on the income it generates. Income is first taxed within the corporation before it can be passed to the shareholders in the form of dividends out of its retained earnings. To avoid double tax on income that passes through a corporation to shareholders (and to prevent any unintended tax advantages), a dividend gross-up and tax credit model is applied at the individual level, along with a tax refund mechanism to the corporation on passive investment income. This is designed to integrate the tax system between the two entities: individual and corporation. Ideally, perfect integration is achieved when after-tax income is equal, whether it is earned individually or through a corporation. In reality, depending on the province and type of income earned, there could be a tax cost in earning passive investment income through a corporation, including earning passive investment capital gains income. Currently there is a tax cost of earning capital gains income through a corporation across all Canadian provinces/jurisdictions.
The latest change further increases the cost of earning passive investment income inside a corporation, though we do not yet know what changes will be made to the corporate tax refund mechanisms. As noted in the table below, the increase averages approximately 8.43% and closely equates the rate on eligible dividends. This rate reflects the initial tax rate on passive investment income earned within an active business.

For many small businesses, and perhaps to long-term individual investors, this increase in the tax rate will feel unfair as the accumulation of earning a pool of assets for retirement is often done within their small business corporation, and in many cases the sole source of retirement funds.
If an immediate crystallization of accumulated capital gains is not desired, what should investors consider in the longer run? Although many details of the new proposed rules are yet to be clarified, here are some general considerations.
For individuals, it may be helpful to plan the timing of future dispositions to stay below the annual $250,000 threshold. Also, it may seem obvious but maximizing investments within registered plans, including the new first home savings plan (FHSA) where eligible, can reduce exposure to future capital gains tax. Moreover, estate planning becomes even more important as the potential tax payable on the deemed disposition of capital property at death rises. On that front, strategies to reduce capital gains at death could be considered, such as inter-vivos gifting, charitable donation, spousal rollover, and acquiring life insurance to provide sufficient liquidity to the estate.
For business owners, some strategies to limit future capital gain exposure may include contributing to an individual pension plan (IPP), conducting an estate freeze to pass on future capital gains to succession owners, and ensuring the small business shares qualify for the LCGE. The suitable strategies are highly dependent on the business needs and personal situation of the business owner.
Acting too soon or not fast enough?
Finally, there is what many in the industry have been calling a “change of law” risk. That is, within the next year and a half, a federal election is scheduled, and this capital gains inclusion tax policy will surely be a primary election issue. As part of that election platform, parties may promise to repeal it outright or alter its scope and application. Consider also that any changes in the capital gains inclusion rate could be retroactive or simply not apply in all cases.
The information provided is general in nature and may not be relied upon nor considered to be the rendering of tax, legal, accounting or professional advice. Invesco Canada is not providing advice. Readers should consult with their own accountants, lawyers and/or other professionals for advice on their specific circumstances before taking any action. The information contained herein is from sources believed to be reliable, but accuracy cannot be guaranteed. Commissions, trailing commissions, management fees and expenses may all be associated with mutual fund investments. Mutual funds are not guaranteed, their values change frequently and past performance may not be repeated. Please read the simplified prospectus before investing. Copies are available from your advisor or from Invesco Canada Ltd
Date posted: May 23, 2024 - Continuing Education