Site Search
362 results for where to check completed case
-
Group Benefits - Premium relief for Dental and Extended Health Care benefits
We know this is a difficult time for Canadian employers and that many of your clients are facing financial hardship as a result of the COVID-19 pandemic. We continue to look for ways to help employers manage while still supporting their employees.
With many health practitioners closing their offices due to the pandemic restrictions, plan member use of dental benefits and some health benefits has declined.
So, we are pleased to announce that we are offering premium relief for all Traditional and myFlex insured non-refund customers for Health and Dental benefits, as follows:
- A 50% reduction on Dental premiums; and
- A 20% reduction on vision and extended healthcare rates (excluding prescription drugs), which equates to an 8% reduction on Health premiums.
These reductions are retroactive to April 1, 2020 and will appear as a credit against the next available billing. We will assess the situation monthly and expect to continue with monthly refunds for as long as the current crisis period continues.
We expect that claims experience and premiums will return to normal once the current pandemic restrictions are lifted.
In the meantime, plan members will continue to have full access to their benefits coverage throughout the pandemic. In many cases, dental offices remain open for emergency services, and a variety of healthcare providers are available virtually.
Commissions
We know the pandemic has put financial strain on your business as well, so we will continue to pay full compensation. Although your overall commission will be unaffected by these premium reduction adjustments, you may see a temporary reduction in your commission payments if you are on a pay-as-earned basis while we put through mass changes. If so, we will then make an additional top-up payment to cover that shortfall as soon as we are able.
Communication
We will be communicating this premium relief program to your clients April 21st at 8:00am EST.
A PDF of the communication is also available here.Questions?
If you have any questions, please contact your Group Account Executive or myFlex Sales Manager. In the meantime, we have provided some Questions and Answers below.
Will the premium reduction on Health and Dental benefits have an impact on the renewals that were deferred?
No. Renewals will proceed as normal, with rate adjustments based only on months where full premium was paid. For most clients, we anticipate “normal” rate adjustments at renewal compared to rates paid prior to refunds taking effect.
Does this adjustment apply equally to clients who have had their renewal deferred?
Yes, these adjustments apply to all Traditional and myFlex insured, non-refund customers for Health and Dental benefits.
How does this affect clients who have terminated or amended a plan?
If a benefit is in-force during the month of April, the adjustment will be credited to the next available billing. For clients who have temporarily terminated all benefits, this will be applied against the first bill once benefits have been reinstated. No cash refunds will be paid.
Will you recover any of the adjustment at a future point in time?
No, we will not recover this adjustment.
Instead of this premium reduction adjustment, can a client cancel or adjust some of the benefits on their plan?
Yes, you and your clients always have the option of changing the coverage on a plan, such as reducing or removing a benefit to help control costs. Please speak to your Group Account Executive or myFlex Sales Manager about the options available.
Are TPAs and self-administered groups eligible for the premium reduction?
Yes. TPAs and self-administered groups are eligible for the premium reduction. However, timing for the credit will be dependent on the billing practices of the TPA or self-administered group. We will apply these credits as soon as we are able. -
Equitable Life Group Benefits Bulletin – May 2020
In this issue:
- Digital options for your clients and their plan members*
- Alberta delaying biosimilar initiative*
- Yukon increasing insurance premium tax*
- Manitoba and New Brunswick relaxing drug limits*
- Free guide to accessing virtual healthcare*
- Homeweb for plan members who are losing coverage*
*Indicates content that will be shared with your clients
Easy and convenient digital resources for your clients and their plan membersDuring this time of physical distancing, people are looking for ways to interact with their providers virtually. We have several convenient digital tools available to make it easier for your clients and their plan members.
For plan administrators:
Plan administrator portal (EquitableHealth.ca)Our secure portal allows plan administrators to easily manage their plan anytime and anywhere. Instead of printing and mailing forms, they can make real-time updates at their convenience. The site also makes it easy to:
- View or upload forms and other important documents;
- Retrieve billing information;
- Estimate monthly premium costs; and
- View announcements, tips and reminders.
Plan administrators can visit www.equitablehealth.ca to activate their account.
Digital Welcome Kits
Instead of paper kits that can easily get lost or quickly become outdated, plan members receive personalized welcome kits via an interactive email, including instructions on how to:
- Activate their online group benefits account;
- Download their digital benefits card;
- Submit claims from their computer or mobile device;
- Review their coverage details; and
- Explore health and wellness resources.
Easy automated payments
Automated payments are a convenient way to avoid missed payments, suspended claims and disruption. Plan administrators simply complete the pre-authorized debit form and send to GroupCollections@equitable.ca. Or contact Group Collections about online banking and electronic funds transfer (EFT).
We can help
For assistance, plan administrators can contact their Client Relationship Specialist or our Web Services team at 1.800.265.4556 ext. 283 or groupbenefitsadmin@equitable.ca.
For plan members:
Plan member portal (EquitableHealth.ca)By logging into EquitableHealth.ca, plan members have secure 24/7 access to their personalized Group Benefits account. They can:
- View and submit claims;
- Review their coverage details; and
- Access health and wellness resources.
Electronic claims payment and notifications
Once plan members have activated their Group Benefits account on EquitableHealth.ca, they can easily set up receiving their claim payments via direct deposit, and their claim notifications via email.
EZClaim Mobile App
Submitting claims is fast, easy and secure with the Equitable EZClaim® mobile app for iOS and Android devices. Plan members can view and submit health and dental claims and review their coverage details.
Digital Benefits Cards
Instead of digging through their wallets, plan members can download a digital version of their benefits card to their mobile device.
We can help
We’ve created a video guide to help plan members access and use their digital resources. For further assistance, plan members can contact our Web Services team at 1.800.265.4556 ext. 283 or groupbenefitsadmin@equitable.ca.
Alberta government delaying biosimilar initiativeAs we announced in the February 2020 issue of eNews, the Alberta Biosimilar Initiative will require patients using several originator biologic drugs to switch to a biosimilar in order to maintain coverage through their Alberta government sponsored drug plan.
Due to the increased demands the COVID-19 pandemic is placing on healthcare providers, the Alberta government has postponed the switching requirement. Affected patients will now have until January 15, 2021 to switch to the biosimilar version of their drug in order to maintain provincial coverage.
We continue to investigate appropriate options to help ensure this provincial change does not unreasonably impact Equitable Life groups and patients and will keep you informed.
For more information about the Alberta Biosimilars Initiative, consult the Alberta government website.
Yukon increasing Insurance Premium TaxThe Yukon Government has announced that it plans to increase its Insurance Premium Tax rates effective January 1, 2021. The premium tax rates for group life and accident and sickness insurance are expected to increase from 2% to 4%. The new tax rates will be applied to premiums paid on or after January 1, 2021.
Manitoba and New Brunswick relaxing drug limitsIn order to protect the drug supply during the COVID-19 crisis, residents of most provinces were temporarily limited to receiving a 30-day supply of drugs when filling a prescription. Normally, doctors prescribe a 90-day supply for most maintenance-type drugs.
The Government of Manitoba and the Government of New Brunswick are now relaxing this 30-day limit for prescription drugs where shortages do not exist. They will address potential shortages of specific drugs if necessary.
As the situation continues to evolve, there may continue to be changes to provincial legislation and prescription limits. Plan members should speak to their pharmacist for the most up to date information.
Free guide to accessing virtual healthcareWith many health clinics closed and the healthcare system under strain, people are looking to access a doctor and other health providers virtually.
As we announced previously, we’ve made it easier for plan members to find the information they need using our Guide to Accessing Virtual Healthcare. This online resource provides information about and links to a range of virtual health services they need to take care of their health and the health of their family during these challenging times.
The Guide also indicates which services are covered by public health plan, so there’s no cost to the patient to access them if they provide their valid provincial health card.
We will continue to update the Guide as more virtual healthcare providers and services become available.The Guide is available on both EquitableHealth.ca and Equitable.ca.
Homeweb for plan members who are losing coverageWe know these are difficult times for Canadian employers and their employees. As businesses temporarily suspend operations, some employers have had to make the difficult decision to temporarily lay off employees or put their benefits coverage on hold.
That’s why we were pleased to announce that Homewood Health® and Equitable Life will extend access to Homeweb, a personalized online mental health and wellness portal, for up to 120 days for plan members who have temporarily lost their benefits coverage due to COVID-19.
Employees and their family members will continue to have access to the Homeweb website and mobile app, including:
- iVolve, online self-directed Cognitive Behavioural Therapy;
- Resources to support themselves and their family members through the COVID-19 pandemic;
- An interactive online Health Risk Assessment; and
- An online library of tools, assessments and e-courses.
This will allow businesses undergoing financial hardship to provide some support to employees who are temporarily without benefits coverage.
-
February 2023 eNews
Responding to Nova Scotia’s biosimilar switch initiative
We are changing coverage for some biologic drugs in Nova Scotia in response to the province’s biosimilar initiative. These changes will help protect your clients’ plans from additional drug costs that may result from this new government policy while providing access to equally safe and effective lower-cost biosimilars.Nova Scotia’s provincial biosimilar initiative
Announced in February 2022, the Nova Scotia Biosimilar Initiative ends coverage of seven biologic drugs for residents enrolled in Pharmacare programs.
Pharmacare patients in the province using these drugs will be required to switch to biosimilar versions of these drugs by February 3, 2023, in order to maintain their Nova Scotia Pharmacare coverage.Equitable Life’s response
To ensure this provincial change doesn’t result in your clients’ plans paying additional and avoidable drug costs, we are changing coverage in Nova Scotia for most biologic drugs included in the provincial initiative.
Beginning June 1, 2023, plan members in the province will no longer be eligible for most originator biologic drugs if they have a condition for which Health Canada has approved a lower cost biosimilar version of the drug.** These plan members will be required to switch to a biosimilar version of the drug to maintain coverage under their Equitable Life plan.Can my client maintain coverage of these biologic drugs?
Traditional groups who wish to opt out of this change and maintain coverage of these originator biologics for Nova Scotia plan members can submit a policy amendment. Amendments must be submitted no later than April 1, 2023. Advisors with myFlex Benefits clients who wish to maintain coverage of these originator biologics for Nova Scotia plan members should speak to their myFlex Sales Manager to confirm their eligibility to opt out of this change.
Groups that choose to maintain coverage of these originator biologics for existing claimants will also maintain coverage for any originator biologics that we subsequently add to our Nova Scotia biosimilar initiative.Will this change impact my clients’ rates?
The rate impact of this change in coverage will be relatively insignificant. Any cost savings associated with the change will be factored in at renewal.
If plan sponsors opt out of these changes and maintain coverage for the originator biologics, it may result in a rate increase. Any rate adjustment will be applied at renewal.Communicating this change to plan members
We will inform any affected plan members in April of the need to switch their medications so that they have ample time to change their prescriptions and avoid any interruptions in treatment or coverage.What is the difference between biologics and biosimilars?
Biologics are drugs that are engineered using living organisms like yeast and bacteria. The first version of a biologic developed is known as the “originator” biologic. Biosimilars are highly similar to the drugs they are based on and Health Canada considers them to be equally safe and effective for approved conditions.Questions?
If you have any questions about this change, please contact your Group Account Executive or myFlex Sales Manager.
**The list of affected drugs is dynamic and will change as Nova Scotia includes more biologic drugs in its biosimilar initiative, as new biosimilars come onto the market, and as we make changes in drug eligibility.
Changes to New Brunswick drug interchangeability rules
We are introducing changes to help ensure that your clients with voluntary or mandatory generic pricing for their drug plans will benefit more from the cost savings of these two features, regardless of the province where the drugs are dispensed.
Currently, when determining whether a lower-cost alternative is available for a brand-name drug, most insurers only consider drugs that the provincial drug plan identifies as interchangeable.
However, the public drug plan in New Brunswick does not identify a drug as interchangeable if the drug is not listed on its formulary – even if Health Canada has deemed the drug interchangeable.
As a result, plans with mandatory or voluntary generic pricing have continued to reimburse some drugs in New Brunswick based on the cost of the brand-name drug, even if a lower-cost generic alternative is available.
Effective March 20, 2023, if your clients have drug plans with mandatory or voluntary generic pricing, we will adjudicate any drug claims in New Brunswick using the lowest cost alternative that Health Canada approves as bioequivalent. This will occur even if the public drug plan has not identified the drug as interchangeable.
To benefit from this more robust drug plan control, plan sponsors must have mandatory or voluntary generic pricing in place.
For more information about this change or about implementing mandatory or voluntary generic pricing for your clients, please contact your Group Account Executive or myFlex Sales Manager.
New template: plan members eligible for additional coverage
Often, based on salary, some plan members may become eligible to apply for extra Life, Accidental Death & Dismemberment (AD&D), Short Term Disability or Long Term Disability coverage. If this occurs, your clients receive a notification from Group Benefits Administration. We have now developed a template that your clients can provide to applicable plan members if they become eligible for extra coverage. The template makes it simpler for your clients to pass on these details to their plan members efficiently.
The new template is available for download under the Quick Links section of EquitableHealth.ca. It is a fillable PDF form that your clients can complete and provide to their plan members when necessary. The document is called Over the Non-Evidence Limit for Plan Members Notification.
If you have any questions about the template, please contact your Group Account Executive or myFlex Sales Manager. - [pdf] Cloud DX FAQ
- [pdf] WorldCare Medical Second Opinion Service
- [pdf] Coverage2go
- [pdf] New Forms to Comply with AML & CRS Changes
-
EAMG Market Commentary October 2023
October 20, 2023
Rates & Credit - Interest rates increased steadily in Q3 against the backdrop of sticky inflation, strong economic growth, and a tight labour market. In Canada, corporate bonds outperformed government bonds and the broader FTSE Canada Universe Index during the quarter, with a loss of 2.2%, versus a loss of 4.4% for government bonds and a loss of 3.9% for the overall index. The outperformance was primarily driven by the fact that the corporate bond index is less sensitive to interest rates movements (as compared to the government index), all else being equal. The outperformance was also driven by an improvement in risk-appetite, with lower-rated BBBs slightly outperforming higher-rated A bonds. Industries with higher interest rate exposure such as infrastructure, energy, and communications underperformed those with less (notably financials and securitization), consistent with the overall shift in the yield curve.
Equities Lose Traction – Global equity markets lost momentum last quarter with the TSX declining 2.2% while major developed economies from Europe, Australasia, and the Far East (EAFE) fell 1.3% in local currency terms. U.S. equity markets, while falling approximately 3.3%, were cushioned by a strong greenback, with the index declining only 1% in Canadian dollar terms. With inflation prints continuing to be stubbornly high and employment data remaining strong, central bankers emphasized their commitment to a higher-for-longer approach to monetary policy. The hawkish tones out of the Federal Reserve pushed bond yields higher and consequently, pressured equities lower. Furthermore, mixed economic data out of China rattled investor sentiment over the quarter as global growth forecasts came under scrutiny.
U.S. Fundamentals – Although U.S. earnings continue to contract on a year-over-year basis, companies surpassed expectations with investors remaining highly focused on signs of deteriorating operating margins. After bouncing off Q1 2022 lows, forward earnings guidance continues to improve on a quarterly basis. Based on our analysis, ~35% of major companies revised earnings forecasts higher (+2% versus Q2) while ~33% held expectations constant, with the balance expecting deteriorating financial performance. Overall, improved efficiencies through cost-cutting measures and stronger-than-expected pricing power have contributed to resilience in operating margins, and therefore renewed optimism about forecasted financial performance.
Equal Weight S&P 500 versus S&P 500 – Persistent crowding into mega-cap technology stocks – which has driven the majority of market returns year-to-date in the U.S. – slowed at the beginning of the summer before reaccelerating into quarter end. The persistence of this trend has resulted in the equal-weighted version of the S&P 500 index returning a mere 1.8% over the first three quarters of the year, markedly lower than the 13.1% return observed from the S&P 500. We continue to emphasize that a crowded market surge is not uncommon during late stages of the economic cycle, and we remain focused on delivering optimal risk-adjusted returns with quantitative factors.
U.S. Quant Factors – The quality-growth areas of the market continued to outperform last quarter with market participants seeking large cash-rich companies with innovative product offerings and stable operating margins. That said, the pricing power of these companies has weakened more recently with consumers having depleted pandemic-era savings and stimulus. As such, fundamentals are beginning to appear overvalued. Low volatility stocks (i.e. stocks with lower sensitivity to broad market movement and lower price volatility) performed in-line with the overall market for most of the summer before underperforming into quarter-end when crowding into big-tech returned. While top-line projections are forecasted to post stable growth, the basket’s relatively lower operating margins remain a headwind amid surging interest rates. Dividend growth companies, which include businesses with a lengthy and established history of increasing dividends, performed approximately in-line with the broader index over the quarter. With the market forecasting overly-negative fundamental performance, this factor is positioned as a contrarian opportunity in the market.
Canadian Fundamentals – Unlike those in the U.S., Canadian companies reported shrinking operating margins in general, pressuring equity pricing. Like in the U.S., Canadian corporate earnings were mostly consistent with expectations but continue to contract on a year-over-year basis. The energy sector benefitted from a ~30% increase in oil prices during the quarter, as OPEC’s restrictive oil production schedule pushed crude markets deeper into under-supplied territory. Those higher energy prices buoyed performance of stocks in the energy sector, one of only two sectors with positive performance during the quarter, helping partially offset softer-than-expected results out of the financials and communications sectors. Meanwhile, the Bank of Canada continued with its hawkish monetary policy by raising its overnight interest rate by another 25 basis points, bringing it to 5%. Their efforts to slow economic growth are beginning to cause some deterioration in fundamentals and, with one quarter remaining, analysts are expecting Canadian earnings to contract ~9% for the year.
Canadian Quant Factors – With central banks around the world continuing to hike interest rates and uncertainty surrounding China’s economic health, global growth prospects fluttered over the quarter. The cyclical nature of the Canadian market, and therefore its reliance on global partners, saw equity prices put under pressure by growth concerns. As a result, the quality bucket benefitted from defensive positioning by investors and thus resumed its climb in Canada. Investors continue to prefer mature, large businesses that are better positioned in a restrictive economic environment due to their more stable operating margins. The value factor – which was beaten down in Q2 – rebounded last quarter with supply-driven energy strength helping to propel energy stocks higher. Low volatility initially displayed similar performance to the TSX, but energy’s rapid surge into the end of summer pressured the group lower. Given higher risk-free rates, the dividend factor also underperformed over the quarter, with dividend yields becoming less attractive on risk adjusted basis.
Views From the Frontline
Rates – Both nominal and real – rose sharply in Q3 to levels not seen since the Great Financial Crisis of 2008. A healthy labour market, strong consumer spending, persistent inflation and excess supply concerns drove the interest rate increase. Although the economy is starting to witness a deceleration in consumer spending and tighter credit conditions, central banks remain committed to maintaining a higher policy rate for longer to bring inflation back to the 2% target.
Credit – The risk premium for corporate bonds (versus government bonds) has been range-
bound over the past quarter as investors’ evaluations of a variety of scenarios have evolved: soft-landing versus a recession, geopolitical uncertainty, further central bank increases, among other things. On the balance, we do not think the current risk premium adequately compensates for downside risk, and as such, we remain cautious on corporate bonds and have a bias towards higher-quality, shorter-dated credit where we view the risk / reward dynamic as being more favourable.
Equities – Geographically, we began the quarter with a preference for U.S. equities relative to Canada and EAFE. In-line with our expectations, U.S. stocks outperformed the two regions in Canadian dollar terms. That said, weakness in the Euro versus the Canadian dollar was a headwind for our EAFE exposure. With earnings yield – which is the percentage of earnings relative to price – becoming less attractive compared to risk-free rates in the U.S., and the greenback strength becoming overstretched from a technical perspective, we have pared back our overweight U.S. position. Moreover, with Chinese officials focusing efforts on the introduction of new stimulus packages, we believe that more cyclical markets like Canada and EAFE will retrace some of their losses in the near term. Within the U.S., we entered Q3 with a constructive view on high quality growth segments of the market that provide strong operating margins during the current late economic cycle conditions. The factor moved in-line with our expectations, as highlighted in the “U.S. Quant Factor” section, and we are tactically decreasing our exposure amid stretched fundamentals. In Canada, we continue to prefer high-quality companies due to their strong fundamentals, with the group currently displaying momentum versus the broader TSX. Tactically, we are participating in the oil supply shock through the value factor.
Downloadable CopyMark Warywoda, CFA
VP, Public Portfolio ManagementIan Whiteside, CFA, MBA
AVP, Public Portfolio ManagementJohanna Shaw, CFA
Director, Portfolio ManagementJin Li
Director, Equity Portfolio Management
Mohamed Bouhadi, CFA
Senior Analyst, Rates
Tyler Farrow
Analyst, Equity
Andrew Vermeer
Analyst, Credit
Elizabeth Ayodele
Analyst, Credit
ADVISOR USE ONLY
Any statements contained herein that are not based on historical fact are forward-looking statements. Any forward-looking statements represent the portfolio manager’s best judgment as of the present date as to what may occur in the future. However, forward-looking statements are subject to many risks, uncertainties, and assumptions, and are based on the portfolio manager’s present opinions and views. For this reason, the actual outcome of the events or results predicted may differ materially from what is expressed. Furthermore, the portfolio manager’s views, opinions or assumptions may subsequently change based on previously unknown information, or for other reasons. Equitable Life of Canada® assumes no obligation to update any forward-looking information contained herein. The reader is cautioned to consider these and other factors carefully and not to place undue reliance on forward-looking statements. Investments may increase or decrease in value and are invested at the risk of the investor. Investment values change frequently, and past performance does not guarantee future results. Professional advice should be sought before an investor embarks on any investment strategy.
Posted November 3, 2023 -
EAMG Market Commentary January 2024
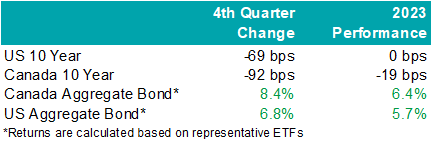
Rates & Credit – Interest rates decreased sharply in Q4 as the market priced in aggressive interest rate cuts by central banks in 2024. The prospect of lower interest rates also drove a strong risk-on tone to the market, with the risk premium on corporate bonds grinding tighter as prospects for a “soft landing” improved. The rally in interest rates resulted in the best quarter for bonds over the past 15 years, with the FTSE Canada Universe Index returning 8.3%. Corporate bonds modestly underperformed the Universe Index with a return of 7.3%. The lower return for corporate bonds was primarily driven by the fact that the corporate bond index is less sensitive to interest rate movements (as compared to the government index), partially offset by the risk-on tone to the market. Within corporate bonds, lower-rated BBBs outperformed higher-rated A bonds. Industries with higher interest rate exposure such as infrastructure, energy, and communications outperformed those with less exposure (notably financials and securitization), consistent with the overall shift in the yield curve.
.png "image1-(1).png")
Santa Came to Town – Moving in sync with bonds, global equities jolted higher into the end of the year with cooling inflation data and dovish comments from central bankers. The U.S. market outperformed most regions last quarter with the S&P 500 returning 11.7% in USD terms, bringing the total return in 2023 to 26.3%. The TSX added 8.1% in Q4, boosting the total annual return to 11.8%. Meanwhile, major developed economies from Europe, Australasia, and the Far East (EAFE) gained 5.0% in local currency terms over the quarter, helping the region produce a 16.8% return from the year prior. Prospects of interest rate cuts by the Federal Reserve saw the Loonie rally into year-end and resultantly, investors of Canadian dollar securities witnessed enhanced returns. Strong domestic U.S. economic data helped value pockets of the market outperform. That said, this was not a synchronized trend as China’s economic disappointment weighed on the performance of EAFE.

U.S. Fundamentals – Our work shows that investors are shifting their focus away from operating margins and towards the ability to sustain debt levels ahead of renewing debt obligations. Corporate earnings beat modest expectations last quarter, contracting by less-than-expected on a year-over-year basis. Resilient operating margins continue to attract investors into equities. After three consecutive quarters of improving forward earnings guidance, we observed that the number of major companies expecting deteriorating financial performance grew to ~35%. We note that this is a sharp contrast relative to the optimistic run-up in equity valuations. In general, corporate pessimism has been underpinned by concerns for the health of the consumer, increasing wage pressures, and inflation.
U.S. Quant Factors – While mega-cap technology stocks gave back some ground in the second half, crowding into the magnificent 7 remains noticeable with the cap weighted S&P 500 outperforming the equal weighted index by 12.5% last year. That said, value areas of the market – which underperformed through the first three quarters of the year – were top performing companies last quarter as the prospects for an economic “soft-landing” improved with U.S. inflation continuing to ease without substantial deteriorations of employment or output data. Quality-growth businesses initially outperformed as the higher-for-longer narrative continued to drive investors toward large cash-rich companies with stable margins. That said, this basket of companies gave back relative returns into quarter-end as weakness in operating margins persisted, making fundamentals appear stretched. Low volatility stocks (i.e. stocks with lower sensitivity to broad market movement and lower price volatility) rallied to start the quarter before dovish comments from central bankers improved risk-sentiment and ultimately pushed this basket lower on a relative basis. Lastly, dividend growth companies, which include businesses with a lengthy and established history of increasing dividends, underperformed the broader index as market participants punished businesses that slowed capital growth projects during the rising interest rate environment. While operating margins have declined, the basket’s strong cash flow and low debt burden may be advantageous if the market’s anticipation of impending interest rate cuts proves to be incorrect or mistimed.
Canadian Fundamentals – Although Canadian companies exceeded bleak forecasts last quarter, earnings continue to contract on a year-over-year basis. Return on equity (ROE) – a gauge of how efficiently a corporation generates profits – continued to decline last quarter while corporate costs of capital remain elevated. In essence, Canadian companies are generating less value relative to their financing cost. Value creation underpins the sustainability of dividend payments, which are a unique and desirable attribute of the Canadian market. Meanwhile, the Bank of Canada held its overnight interest rate unchanged with market participants forecasting a higher probability of interest rate cuts in 2024. On the expectations of easing monetary conditions, dividend yields compressed while earnings forecasts improved with analysts predicting that index aggregate earnings will grow 6% to 8% in 2024. At a sector level, the energy industry’s financial performance normalized – in line with expectations – as weakening oil demand expectations overshadowed geopolitical conflict in the Middle East, ultimately pushing crude prices ~21% lower last quarter. The industrials and financials sectors beat expectations, helping offset softer-than-expected results from the consumer staples and technology sectors.
Canadian Quant Factors – The Canadian banks underperformed for most of the year as they reported increasing provisions for nonperforming loans, reflecting forecasts of worsening economic conditions. That said, expectations of interest rate cuts in 2024 helped tame recession fears and eased concerns of slowing loan growth, propelling banks higher in the fourth quarter as they appeared more stable and therefore favourable than prior estimates. The high-quality basket underperformed last quarter as improving risk sentiment in the market reduced the attractiveness of secure companies with lower earnings variability. Furthermore, high dividend payers with solid growth prospects outperformed in the fourth quarter as market participants rewarded companies that demonstrated a strong ability to support future dividends and punished high yielding businesses with less certain financial capabilities.
Views From the Frontline Rates – Interest rates declined sharply in Q4 as inflation continued to trend lower, fears of excess bond supply declined, and the Federal Open Market Committee signaled that the next change to their overnight policy interest rate would likely be lower. Labour market and consumer spending data remain resilient however businesses have indicated slowing across industries, more price-sensitive consumers, rising delinquencies, and concerns about the high cost of debt. Central banks remain committed to achieving their 2% inflation target and most acknowledge that interest rates have likely peaked.
Credit – The risk premium for corporate bonds (versus government bonds) tightened materially over the quarter, with a strong risk on tone to the market as investors priced in lower interest rates in 2024 and a “soft-landing” to economic concerns. Corporate bond supply was well received by the market. On the balance, we do not think the current risk premium adequately compensates for downside risk, and as such, we remain cautious on corporate bonds and have a bias towards higher-quality, shorter-dated credit where we view the risk / reward dynamic as being more favourable.
Equity – In the U.S., we allocated exposure to value names which outperformed over the quarter as the macroeconomic outlook improved on the backdrop of rate cut expectations. Looking forward, we expect that margins will continue to normalize as Covid-induced pent up demand fades. While we do not forecast margins to compress at an alarming rate, we believe sticky wage and input costs will continue to pressure businesses while consumers exhibit further exhaustion. As such, we are shifting our focus toward the balance between company reinvestment in capital projects and upcoming debt refinancing requirements. In line with this view, we favour businesses with stable cash flows and decreased debt loads as we believe they present an attractive contrarian opportunity if soft-landing projections prove to be overstated. Within Canada, we remain attentive to the inverse movements of ROE relative to financing costs over 2023. With the excess between ROE and financing costs compressing, businesses’ ability to create value appears more stretched than earlier in 2023. Therefore, we continue to favour high quality companies in Canada, which is typically defined by high ROE, stable earnings variability, and low financial leverage. Geographically, the U.S. economy appears to be in healthier condition with inflation easing while employment and output data remain stable and hence, our focus will be on capital expenditures. EAFE – which is generally more economically linked to China than North America – contains a large bucket of stable, high-quality businesses that may benefit from any upside economic surprises out of China. Lastly, through the lens of a Canadian investor, the Loonie’s relative value versus other major currencies presents another resource in our investment mandate to derive excess return.Downloadable Copy
Mark Warywoda, CFA
VP, Public Portfolio ManagementIan Whiteside, CFA, MBA
AVP, Public Portfolio ManagementJohanna Shaw, CFA
Director, Portfolio ManagementJin Li
Director, Equity Portfolio Management
Tyler Farrow, CFA
Senior Analyst, Equity
Andrew Vermeer
Senior Analyst, Credit
Elizabeth Ayodele
Analyst, Credit
ADVISOR USE ONLY
Any statements contained herein that are not based on historical fact are forward-looking statements. Any forward-looking statements represent the portfolio manager’s best judgment as of the present date as to what may occur in the future. However, forward-looking statements are subject to many risks, uncertainties, and assumptions, and are based on the portfolio manager’s present opinions and views. For this reason, the actual outcome of the events or results predicted may differ materially from what is expressed. Furthermore, the portfolio manager’s views, opinions or assumptions may subsequently change based on previously unknown information, or for other reasons. Equitable® assumes no obligation to update any forward-looking information contained herein. The reader is cautioned to consider these and other factors carefully and not to place undue reliance on forward-looking statements. Investments may increase or decrease in value and are invested at the risk of the investor. Investment values change frequently, and past performance does not guarantee future results. Professional advice should be sought before an investor embarks on any investment strategy.
-
EAMG Market Commentary April 2024
April 2024
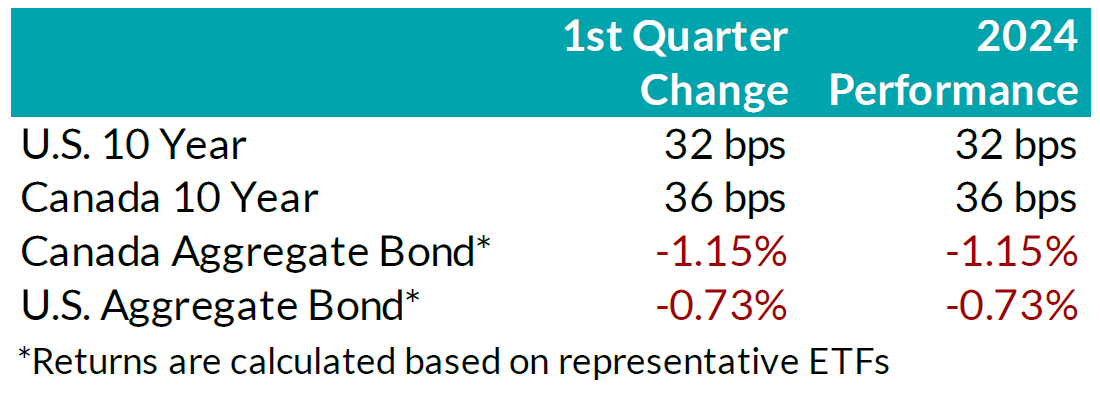
Rates & Credit – Interest rates increased in Q1 2024, giving back half of the decline experienced in Q4 2023 amid consistently positive surprises in U.S. economic data. The positive economic news also drove a strong risk-on tone to the market, with the risk premium on corporate bonds tightening as economic prospects improved. In Canada, corporate bonds outperformed government bonds and the broader FTSE Canada Universe Index (FTSE) with a slightly positive 0.07% return, verses a loss of 1.66% in government bonds and a loss of 1.22% for the overall index. More interest rate sensitive long-term bonds experienced the largest decline, which was partially offset in corporate bonds by the risk-on tone to corporate bond spreads. On a 6-month and 1-year basis, the FTSE remained positive at 6.94% and 2.10%, respectively. Within corporate bonds, lower-rated BBBs outperformed higher-rated A bonds, while industries with higher interest rate exposure such as infrastructure, energy, and communications underperformed those with less exposure (notably financials and securitization).
.png?width=850&height=303 "chart1-(4).png")
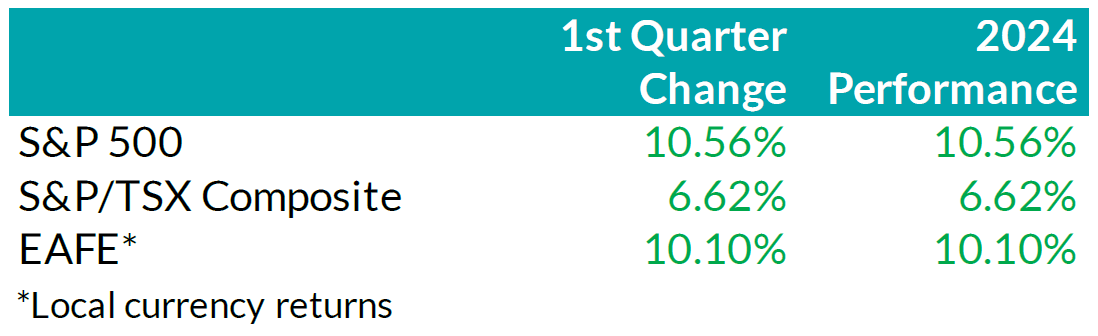
Equity Overview – Throughout Q1 2024, concerns about a recession gradually eased as central bankers adopted a more accommodative outlook on monetary policy. Their growing dovishness reflected confidence that the restrictive monetary measures were effectively curbing inflation as anticipated. Underpinned by prospects of an economic soft-landing, global equity markets rallied to start the year with most major North American indices soaring to new all-time highs during the quarter. U.S. equities continued to outperform other major international markets with the S&P 500 returning 10.6% in USD terms. Major developed economies from Europe, Australasia, and the Far East (EAFE) gained 10.1% in local currency terms, while the TSX added 6.6%. Furthermore, the U.S. economy continued to prove more resilient than most major developed economies, with strong employment and robust output data. As such, foreign investors of U.S. denominated securities achieved enhanced returns, benefitting from a stronger Greenback.
.png?width=850&height=260 "chart2-(1).png")
U.S. Fundamentals – Corporate earnings beat expectations in Q4 2023, triggering a wave of upward earnings revision. Stable operating margins, cash flows and debt loads continue to attract investors into equities. Investors appear focused on the company’s ability to sustain debt levels ahead of renewing debt obligations. We observed that the number of major companies that expect improving financial performance shrunk to ~19%. This suggests that concentration risks are likely brewing in the equity market, yet again.
U.S. Quant Factors
Optimistic run-up in equity valuations were mostly driven by the momentum factor. A basket of companies with positive price trends intensified concentration risk in the equity market. We note that momentum factor’ performance sharply contrasted fundamental factors, making us cautious on the market’s complacency. For context, high quality companies, which is typically defined by high Return on Equity (ROE), stable earnings variability, and low financial leverage, placed second in our risk-adjusted performance rankings, and is dwarfed by the ~ 17.9% return observed from the momentum factor.
Canadian Fundamentals – Against the backdrop of underwhelming financial results, ROE – a gauge of how efficiently a corporation generates profits – rebounded in Q4, 2023, after declining throughout most of the year. The improved efficiency metric provided a positive catalyst for dividend investors as the inverse movements of ROE relative to financing costs over 2023 kept investors on the sidelines. In addition, the CRB Raw Industrials Index, a measure of price changes of basic commodities, broke out of recent ranges, providing a tailwind for Canada’s energy and materials sector. Concerns with earnings contraction and macro-economic conditions have subsided.
Canadian Quant Factors – Crude prices soared higher in Q1 2024, with ongoing production cuts from OPEC+ and ramifications of geopolitical conflicts keeping oil markets undersupplied. As such, energy companies benefitted, surging higher and outperforming the broader index, while the low volatility basket – with lower exposure to cyclically sensitive business – underperformed into quarter end. Furthermore, Canadian banks underperformed to start the quarter, giving back some of the sharp outperformance witnessed into the end of Q4 2023. That said, soft inflation data increased expectations of impending rate cuts from the Bank of Canada and, as such, banks performed in line with the broader market throughout most of the quarter. Underpinned by expectations of a dovish switch in monetary policy, investors rewarded dividend payers with a history of increasing dividends, boosting confidence in their ability to support future dividend growth. It is important to note that investors should not let dividend growth’s outperformance overshadow high dividend paying companies’ underperformance; more specifically, investors remain attentive to the businesses’ ability to create value relative to financing costs.
Views From the Frontline
Rates – Interest rates in both Canada and the U.S. increased across all bond tenors in Q1 2024. U.S. inflation data surprised to the upside, remaining stubbornly higher than hoped, while labour market and consumer indicators underscored the economy's continued strength. In Canada, inflation data fell below forecasts, but early 2024 GDP readings exceeded expectations. The market now anticipates a 'soft landing' for the U.S. economy; however, the Canadian economy continues to slow. North American central banks have signaled that we are at the peak for policy rates. The market is currently pricing in approximately two-to-three, 25 basis point interest rate cuts by the U.S. Federal Reserve in the second half of 2024, much fewer than the six-to-seven 25 basis point interest rate cuts that the market had been anticipating even just three months ago. As the Swiss central bank led the way with the first rate cut among developed countries, central banks in major developed economies will closely monitor upcoming data and market developments to determine the timing and pace for rate cuts.
Credit – The risk premium for corporate bonds (versus government bonds) continued to tighten over the quarter, with a strong risk-on tone to the market as investors priced in renewed economic growth in 2024 as compared to previous expectations. Corporate bond supply was robust, with $38.2bn in new issuance, the second strongest first quarter on record. On the balance, we do not think the current risk premium adequately compensates for downside risk, particularly in longer-dated corporate bonds, and have a bias towards shorter-dated credit where we view the risk / reward dynamic as being more favourable.
Equity – We favour a combination of the Dow Jones and the S&P500 for our broad market exposure. The Dow, a price-weighted index, should have some value and low volatility tilt as it tracks mature large companies. As explained above, concentration risks are brewing in the equity market, and during Q1 this risk was exacerbated by investors rushing into a basket of companies with positive price trends, thereby pushing valuation metrics further into the expensive territory. In our view, it is well-suited to use a combination of the Dow Jones Industrial Average and the S&P 500 for broad U.S. market exposure given the heightened concentration risk. Looking forward, we expect companies to exhibit stable operating margins and therefore, we are shifting our focus toward the balance between upcoming corporate debt refinancing requirements and reinvestment in projects intended to drive future growth. In plain words, we are tactically adding to companies with stable cash flows and decreased debt loads outside of the mega-cap group. In Canada, we expect a modest earnings growth and remain attentive to how efficiently a corporation generates profits relative to their financing cost. We caution against the overly optimistic, commodity driven, “catch-up” trade vs. our southern neighbour. Therefore, we tweaked our investment strategy by rotating out of the low volatility factor and adding to higher yielding quality companies in Canada.
Downloadable Copy
Mark Warywoda, CFA VP, Public Portfolio Management Ian Whiteside, CFA, MBA AVP, Public Portfolio Management Johanna Shaw, CFA Director, Portfolio Management Jin Li
Director, Equity Portfolio ManagementTyler Farrow, CFA
Senior Analyst, EquityAndrew Vermeer
Senior Analyst, CreditElizabeth Ayodele
Analyst, CreditFrancie Chen
Analyst, Rates
ADVISOR USE ONLY
Any statements contained herein that are not based on historical fact are forward-looking statements. Any forward-looking statements represent the portfolio manager’s best judgment as of the present date as to what may occur in the future. However, forward-looking statements are subject to many risks, uncertainties, and assumptions, and are based on the portfolio manager’s present opinions and views. For this reason, the actual outcome of the events or results predicted may differ materially from what is expressed. Furthermore, the portfolio manager’s views, opinions or assumptions may subsequently change based on previously unknown information, or for other reasons. Equitable® assumes no obligation to update any forward-looking information contained herein. The reader is cautioned to consider these and other factors carefully and not to place undue reliance on forward-looking statements. Investments may increase or decrease in value and are invested at the risk of the investor. Investment values change frequently, and past performance does not guarantee future results. Professional advice should be sought before an investor embarks on any investment strategy.